Appetite for Noise: I Tested the Ozempic Spending Story on the National Data
Walmart's CEO, Morgan Stanley, and a string of analyst notes say GLP-1 drugs are already bending US restaurant, alcohol, and grocery spending. The obvious before/after test on FRED data gives a confident, significant, directionally wrong answer. Here's what survives proper inference and a real pre-trend, and how big the effect actually is.
About one in eight American adults is now on a GLP-1. Walmart's CEO, Morgan Stanley, and a string of analyst notes say Ozempic and its cousins are already bending consumer spending away from restaurants, alcohol, and snacks. The question I wanted to answer is small but irritating: can you actually see it in the national aggregate, or is the narrative running ahead of the data?
Why I built it
Zach O'Hagan at Zerve suggested the use case: "GLP-1 second-order effects on the economy, using credit-card data proxies, restaurant traffic, alcohol sales, and obesity-related spending, quantify the spending shifts attributable to Ozempic adoption." Same spine as my previous Zerve project (Polymarket Decoded): take a market narrative, test it against primary data, name the gap, own the limitations.
Real credit-card panels (Affinity, Earnest, Consumer Edge) are paid. FRED's monthly retail and food-services aggregates are the public version of the same underlying spending: same shape, less granularity. I call that out rather than hide it.
What the obvious test says
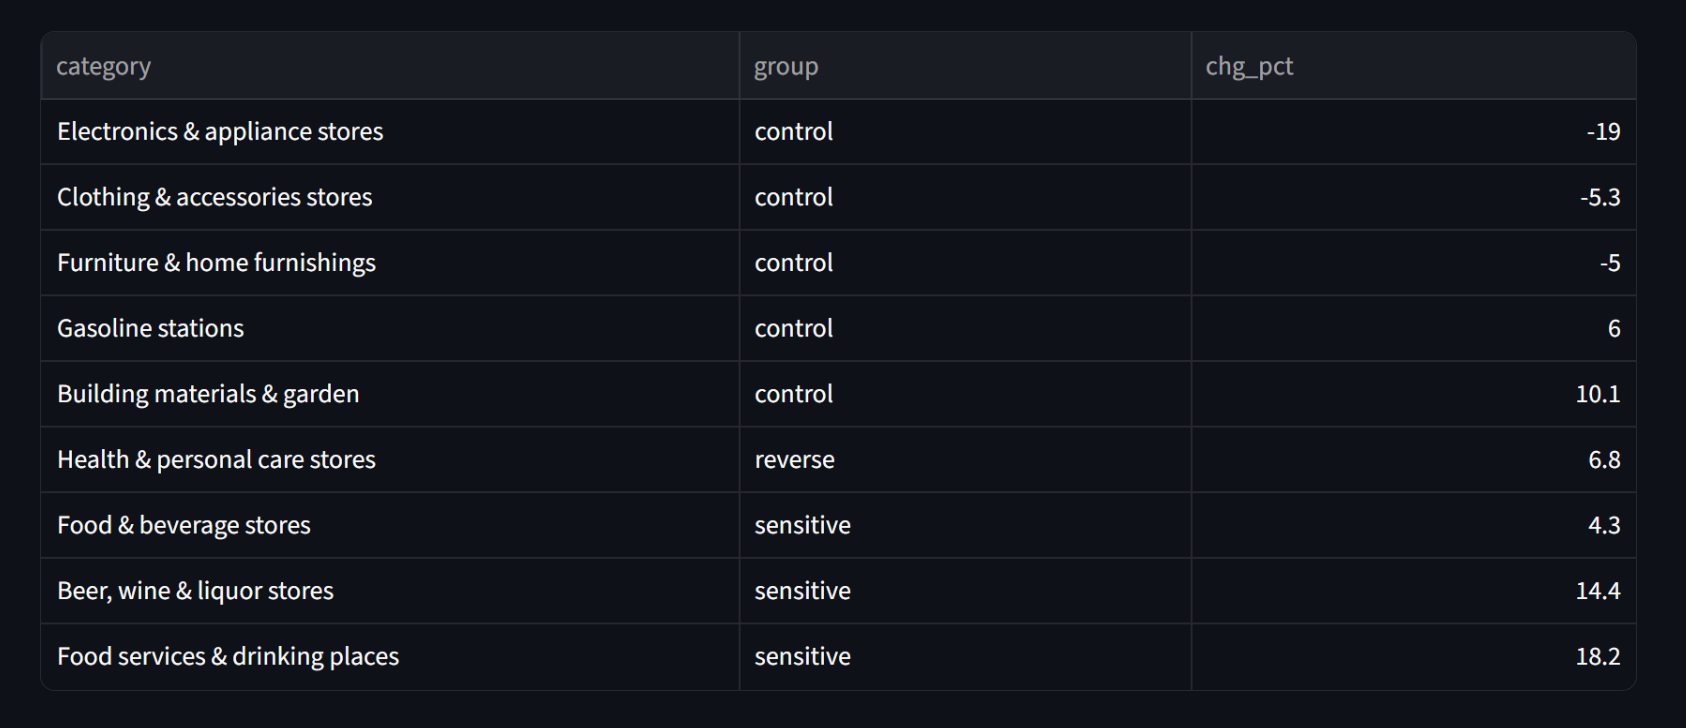
Treated group: restaurants, beer/wine/liquor stores, food and beverage stores. Control group: gas, apparel, furniture, electronics, building materials. Difference-in-differences before and after the 2022 GLP-1 ramp, on inflation-adjusted spending (each category deflated by its own CPI, indexed to 2019 = 100).
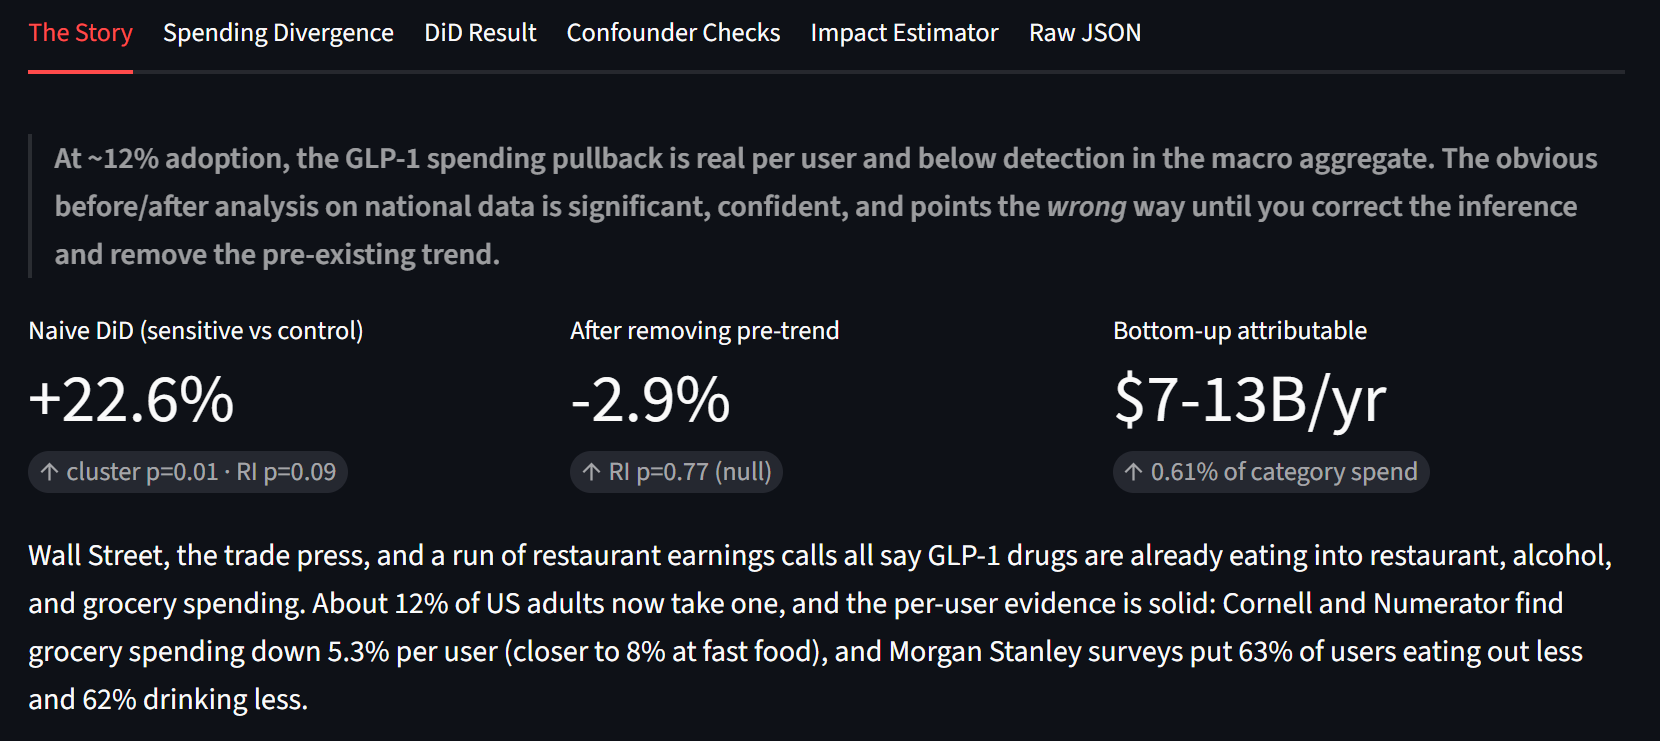
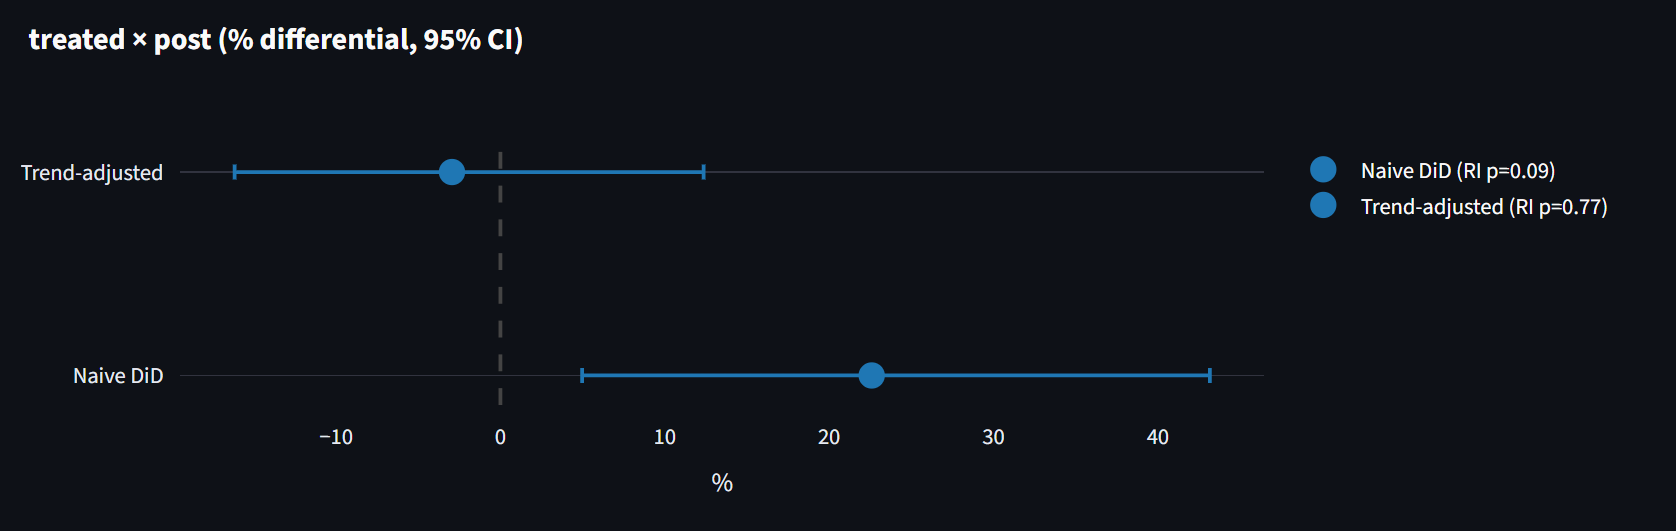
The textbook answer comes back significant: +22.6%, cluster-t p = 0.010, 95% CI [+5.0, +43.2]. Look at the sign though. The GLP-1-sensitive categories grew faster than the controls, not slower. If you stopped here you would write "GLP-1 has no effect, restaurants are booming." That headline would also be wrong.
Why that number is misleading on two counts
Inference first. With only three treated categories, cluster-robust standard errors are known to over-reject sharply (Conley-Taber 2011, MacKinnon-Webb). Instead of trusting the formula I permuted the treatment label across all 56 ways to pick 3 of the 8 categories and ranked the real estimate against that distribution. The honest randomization-inference p-value is 0.089, not 0.010. Not significant at 5%.
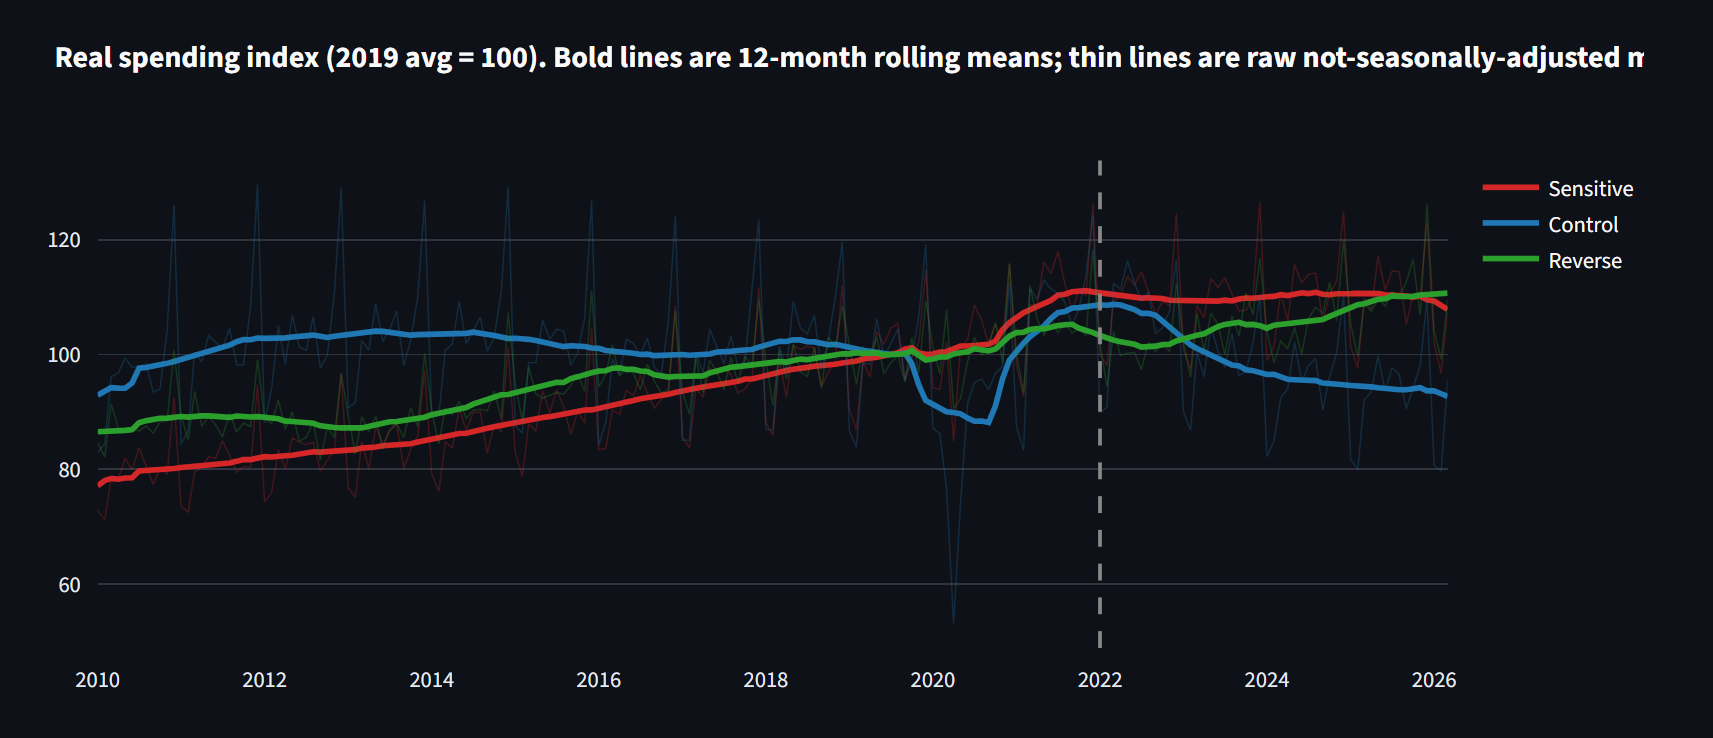
Identification second. I ran the same model with a fake treatment date of 2018, before any of these drugs mattered and before COVID. If the design were clean, the placebo should be zero. It comes back +13.9%, the same gap, years before GLP-1 existed.
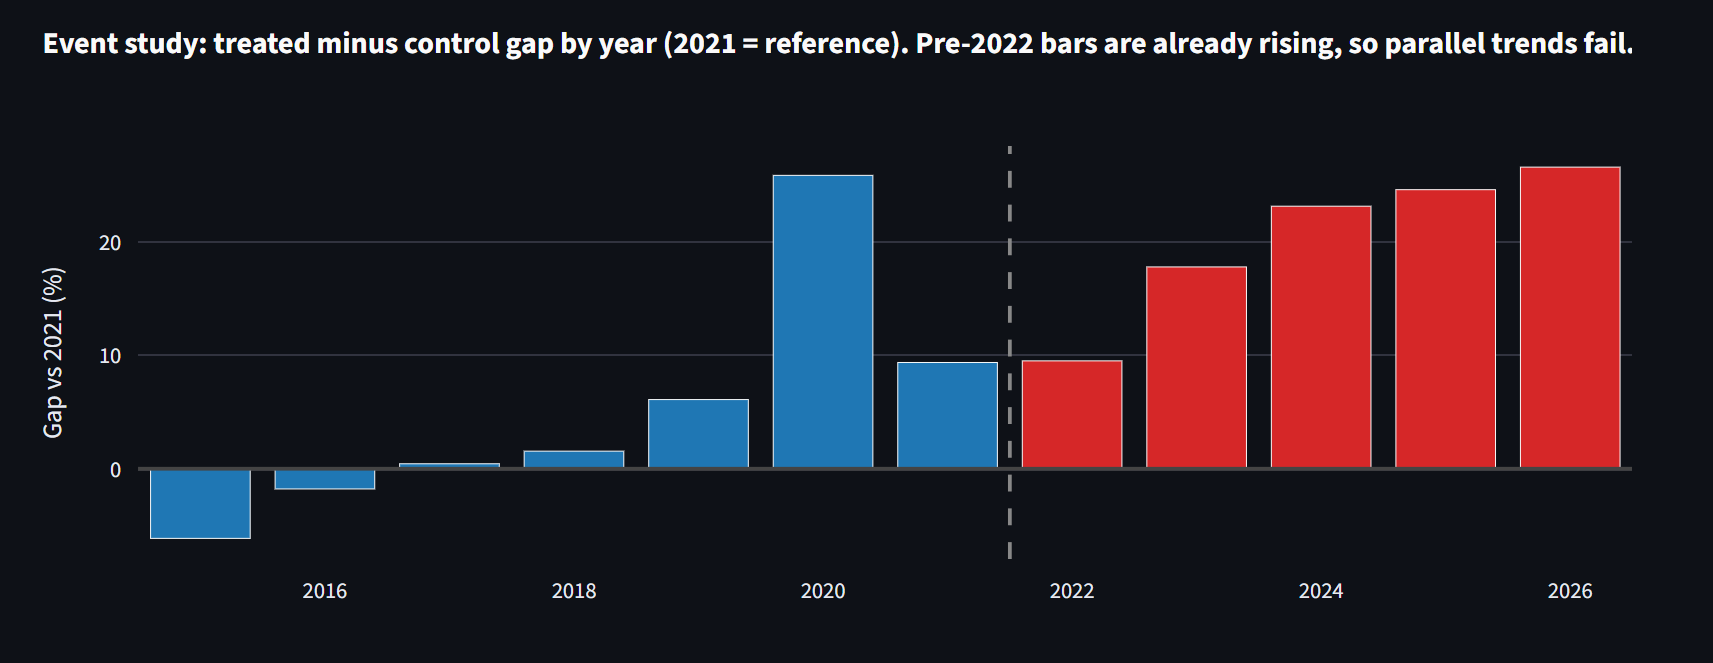
A formal joint F-test on those pre-2022 trends rejects parallel trends, the assumption the whole method rests on, at F = 80, p < 0.0001. The framing here follows Rambachan and Roth (2023): rather than assume parallel trends hold, I show they demonstrably do not, and report what is left after de-trending.
The honest answer, three ways
- Trend-adjusted DiD (each group with its own trend): -2.9%, 95% CI [-16.2, +12.4], randomization-inference p = 0.77. Statistically zero.
- Dose-response (continuous adoption curve from Block 2 as the treatment instead of a binary post dummy): -2.2% per SD of adoption, p = 0.31. The gap stops tracking adoption once the trend is removed.
- Robustness sweep: ex-COVID window, clean 2015-2019 pre-period, restaurants + alcohol only, dropping volatile-priced gas, a cutoff sweep from 2021-06 to 2023-01. The null survives every variant.
Translating to dollars without faking precision
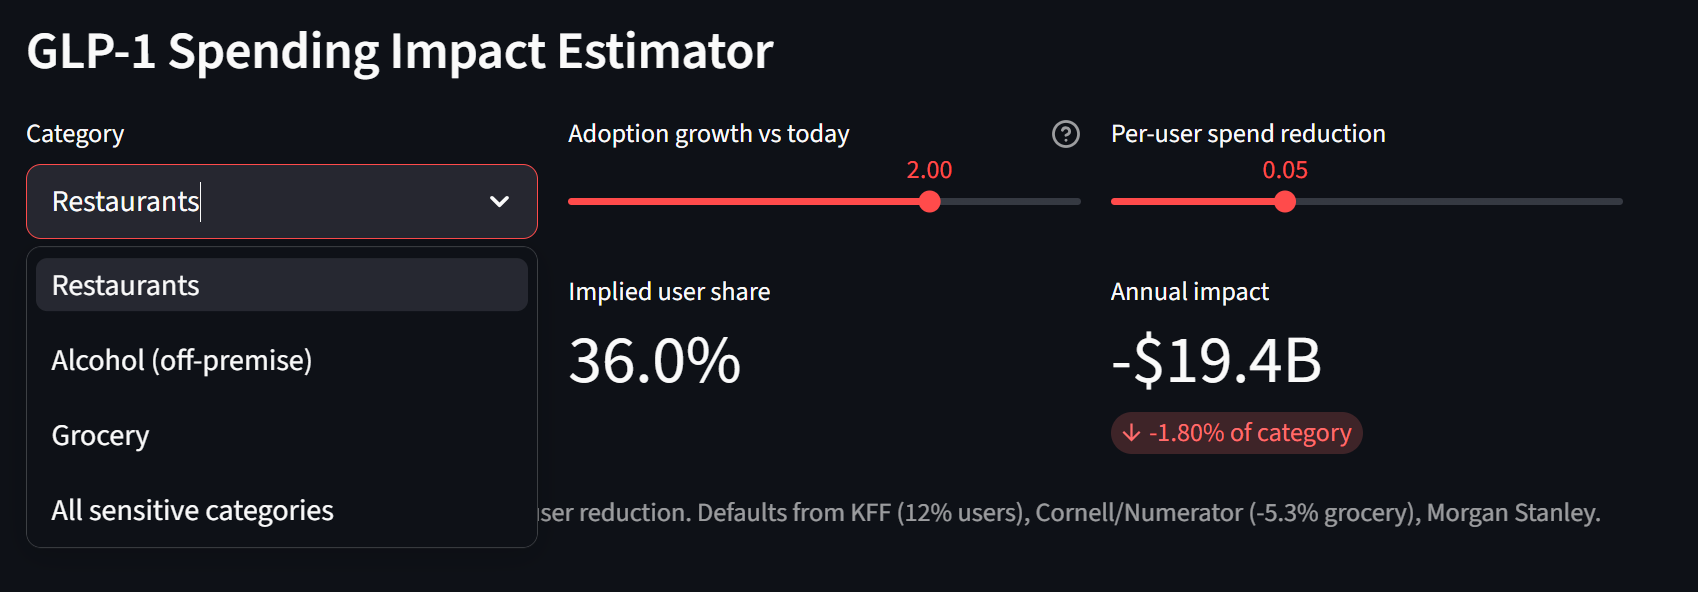
The per-user effect is real and documented: Cornell/Numerator find grocery spending down 5.3% per GLP-1 user within six months, fast food down 8%, savory snacks down 11%, larger for higher-income households. At ~12% adult adoption across the $2.16T America spends in these categories ($1,075B restaurants, $1,017B grocery, $71B liquor stores), bottom-up arithmetic lands at roughly $7-13B per year, about 0.3-0.6% of the category.
The range is honest about the restaurant direction. Numerator and Circana transaction data show GLP-1 users actually spending more at full-service restaurants while fast food and grocery fall, so an aggregate "restaurants down" prediction is not even clean at the micro level. The floor credits no restaurant cut, the ceiling credits the Morgan Stanley survey number. Either way it is a rounding error against the secular shift to services and the post-COVID recovery that dominate the aggregate.
How I built it
Ten Python blocks in a Zerve canvas, chained through pandas dataframes. Block 1 pulls monthly FRED retail/food-services and BLS CPI series back to 2010 with a Secret Constant for the FRED key. Block 2 builds a GLP-1 adoption index anchored to FDA approvals (Ozempic 2017, Wegovy 2021, Mounjaro 2022, Zepbound 2023) and the documented script trajectory (0.3M/mo to 3.5M/mo, 2017 to 2024), tries Google Trends via pytrends, and falls back to an embedded calibrated series so the deployed apps never depend on a flaky endpoint.
Blocks 3 through 5 are the analysis spine: deflation by category-specific CPI (restaurants by food-away-from-home, liquor by alcoholic-beverages, grocery by food-at-home, controls by headline), category aggregation, then the DiD itself in statsmodels with cluster-robust errors AND a manual randomization-inference loop over all 56 treatment labelings. Block 5 also runs the dose-response so the adoption curve from Block 2 feeds the inference, not just the narrative.
Block 6 is the brutal-honesty block: ex-COVID windows, the placebo, the cutoff sweep, the event study with a formal joint F-test on pre-trends, dropping gas, redeflating it. Block 7 attributes the bottom-up dollar figure. Blocks 8 through 10 are Plotly visuals, a FastAPI service, and a Streamlit dashboard. Both deployments use FRED's keyless CSV endpoint, so the live apps need no secret.
What was hard
The trap was the very small number of treated clusters. Three categories sounds fine until you remember that cluster-robust t-stats need many groups to behave. The fix (randomization inference over the 56 labelings) is textbook for exactly this case, but the result is uncomfortable: the headline drops from p = 0.01 to p = 0.09. You have to be willing to publish that.
The other trap was treating parallel trends as a checkbox. Most DiD writeups state the assumption and move on. Here it visibly fails. The right move was to lead with the pre-trend test and treat the trend-adjusted spec as the defensible one, not bury the failure in an appendix. The Rambachan-Roth framing helped me articulate that.
Smaller pain: FRED's October-2025 CPI gap from the BLS shutdown is interpolated in Block 3, the food-services line (NAICS 7225) lumps full-service and fast food (exactly the split where the micro evidence diverges), and liquor-store sales miss on-premise alcohol entirely. The aggregate cannot isolate the sub-categories where GLP-1 effects are cleanest. I call that out in the limitations section of the README rather than pretending the macro number is precise.
What it means, and what would change the answer
The finding is not "GLP-1 has no effect." It is that the obvious way to measure it gives you a significant-looking, wrong-direction answer, and once you fix the inference and the trend the real effect is currently too small to see in the macro aggregate. The per-user pullback is real. The economy-wide one is below detection.
Three things would change that. Higher adoption (oral GLP-1 pills launched in late 2025, Lilly's orforglipron in April 2026, Novo cut US prices up to 70%, a Medicare demo at $50/month begins July 2026). A longer post-period once the post-COVID services rebound washes out. Category-level credit-card panel data that can separate users from non-users instead of relying on the population aggregate. The method is ready; the signal-to-noise just isn't there yet at the macro level.
If you liked this, the previous project in the series ran the same shape of test on prediction-market settlement prices and found a 32 percentage-point structural framing bias.

Warden: I Built an Agent That Governs Your Other Agents
Once you have a fleet of AI agents acting on real systems (approving refunds, changing prices, moving inventory), who watches them when one goes rogue? Warden is the supervisor I built for the Google Cloud Rapid Agent Hackathon: Dynatrace MCP for senses, Gemini 3 for judgment, a real human-in-the-loop approval gate, and honest dollar accounting for every incident.

Giving a Mod Team a Memory
Reddit's modqueue treats every moderator as a lone agent clearing an inbox. The hardest part of moderating isn't volume, it's the isolation of the borderline call, the inconsistency that creeps across a team, and the judgment that walks out the door when a veteran leaves. Memex is the memory that's missing.